How to Monitor SNMP devices with Telegraf and InfluxDB and Grafana | Meraki WAN Data
Why did i write this…
Every IT admin needs to know what is going on in their environment at all times. Having a dashboard in your office on a TV and active alerts to your phone is critical in our careers. You ideally want to know about the problem before end users start calling. That’s why SNMP is very important and being able to use it to your advantage will make your life easier.
Simple Network Management Protocol (SNMP) is an Internet Standard protocol for collecting and organizing information about managed devices on IP networks and for modifying that information to change device behavior. In this write-up, I will show you how you can use SNMP to collect and Graph Meraki devices network usage.
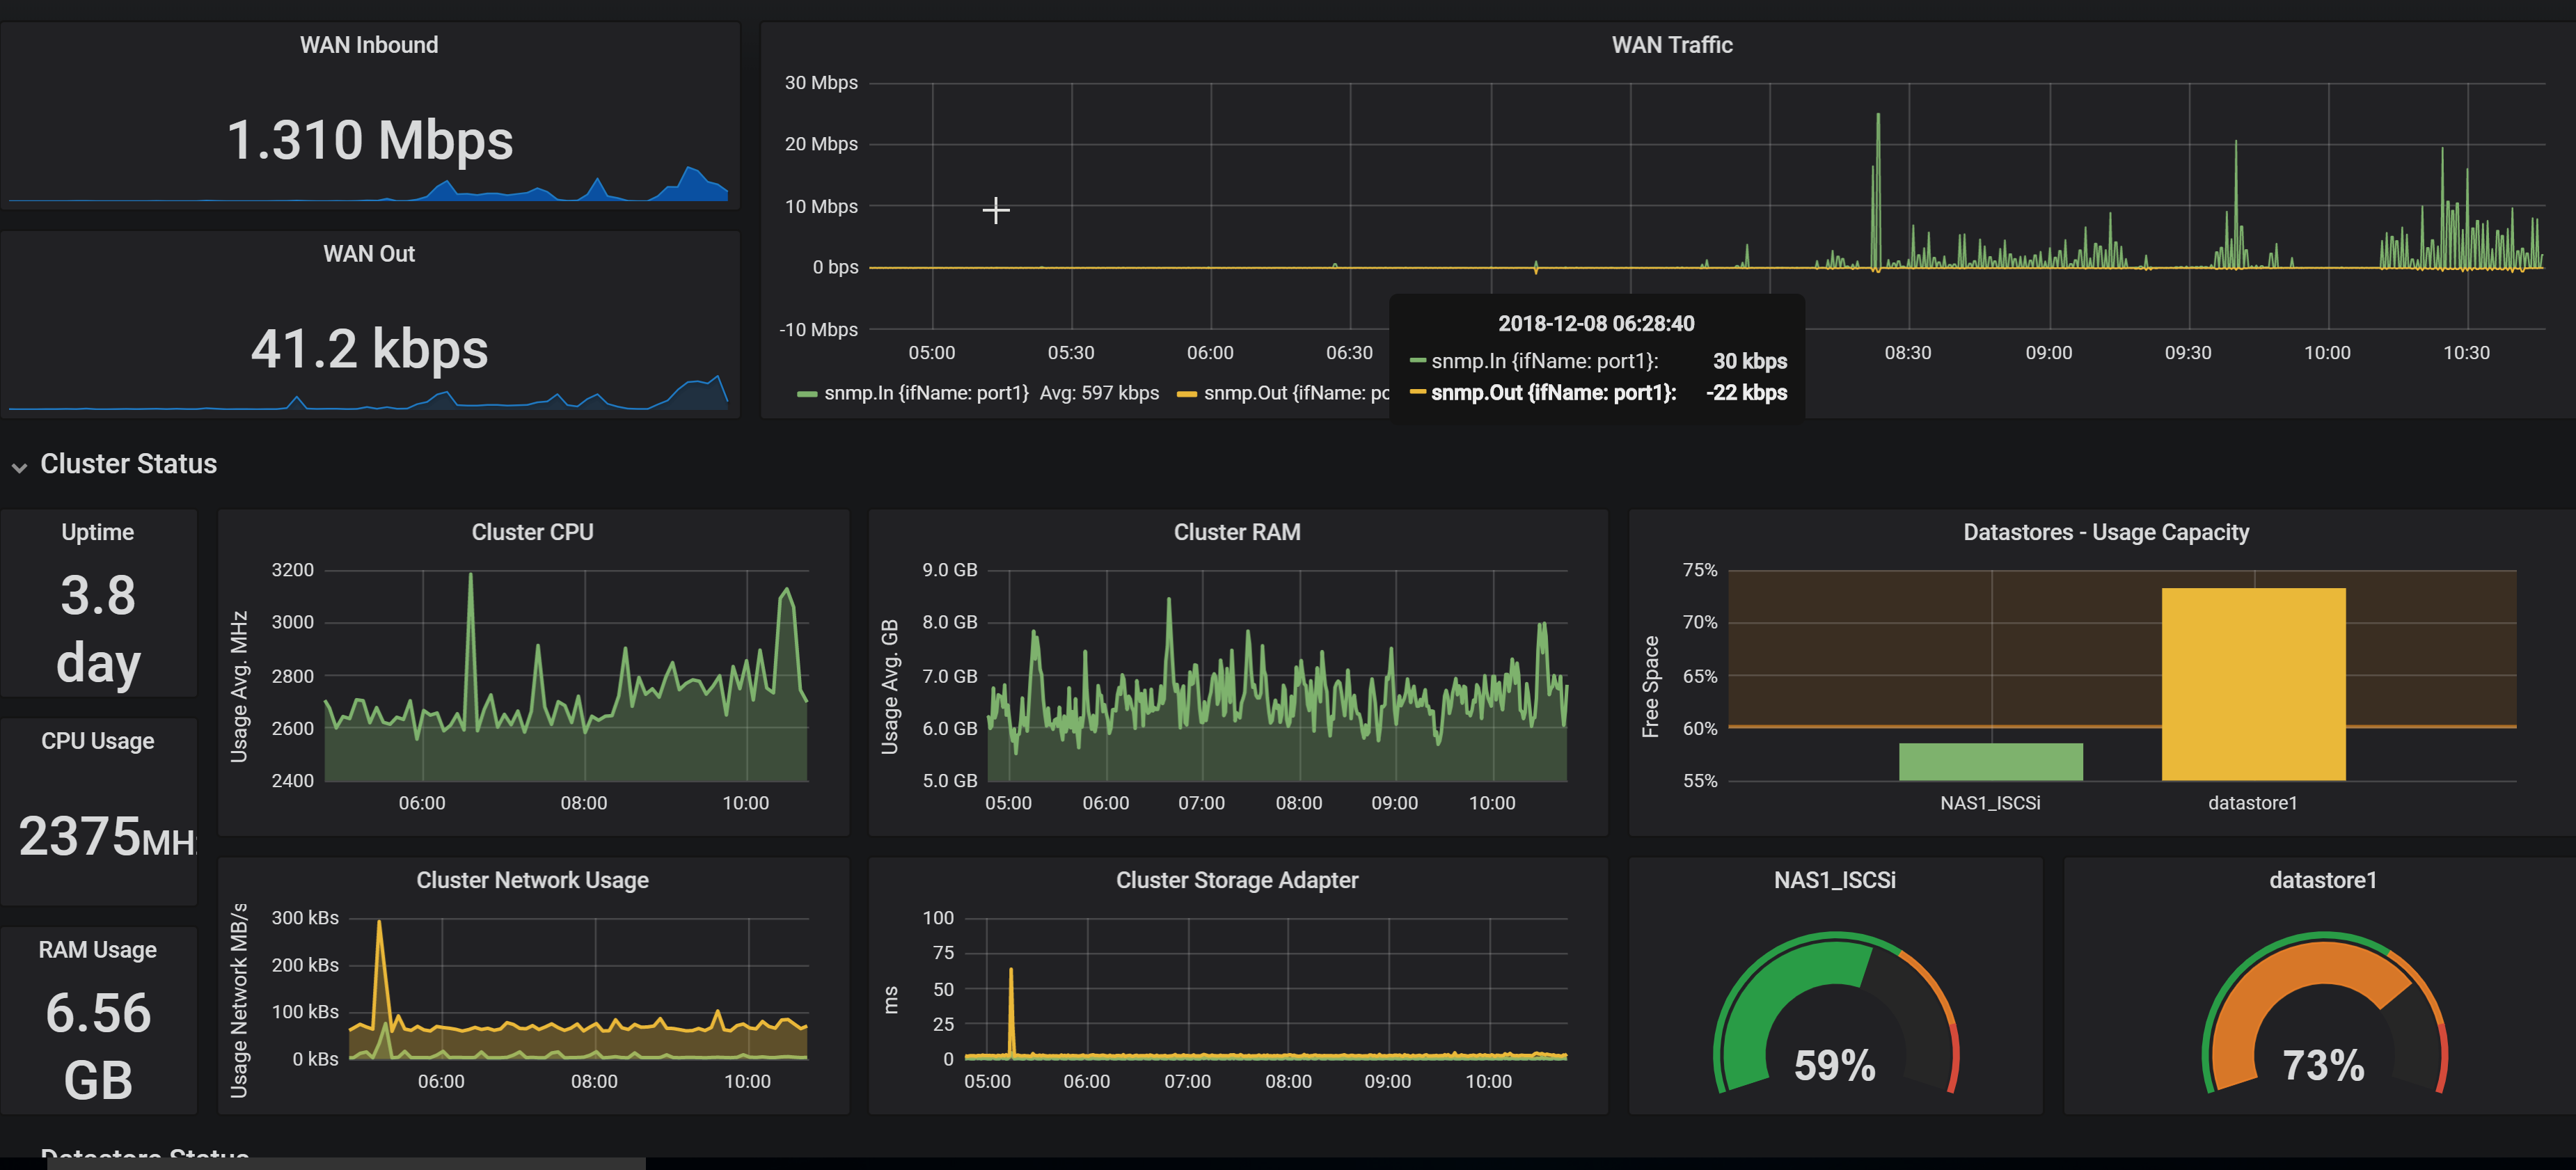
****I know Meraki already has a dashboard, but I wanted more flexibility and to be able to integrate that dashboard with my existing Grafana Dashboards as you can see ( WAN Info) bellow:

I like all my “critical” lab metrics in one dashboard that I can refresh every 5s.
Here is a video that i made about this setup:
Requirements
You need to have a running Grafana, Influxdb and Telegraf environment. Check out my youtube channel for a video on how to install all these 3 in a lab environment on Docker in 10 minutes: https://youtu.be/xWnI3sHMbGI
Important Notes
- I use CentOS7 for this setup.
- I have two separate vms. (You will see that in the video above) one for collecting metrics (Datacollector) and another running Telegraf and InfluxDB and Grafana in Docker.
- All my vms are in vMware (slowly moving to proxmox)
- I will be collecting SNMP data from a Meraki MX65.
Step 1 : Enable SNMP on your device ( Meraki MX65, MR33 and MS120 for me)
Enable SNMP on your device. I followed these meraki instructions: https://documentation.meraki.com/zGeneral_Administration/Monitoring_and_Reporting/SNMP_Overview_and_Configuration
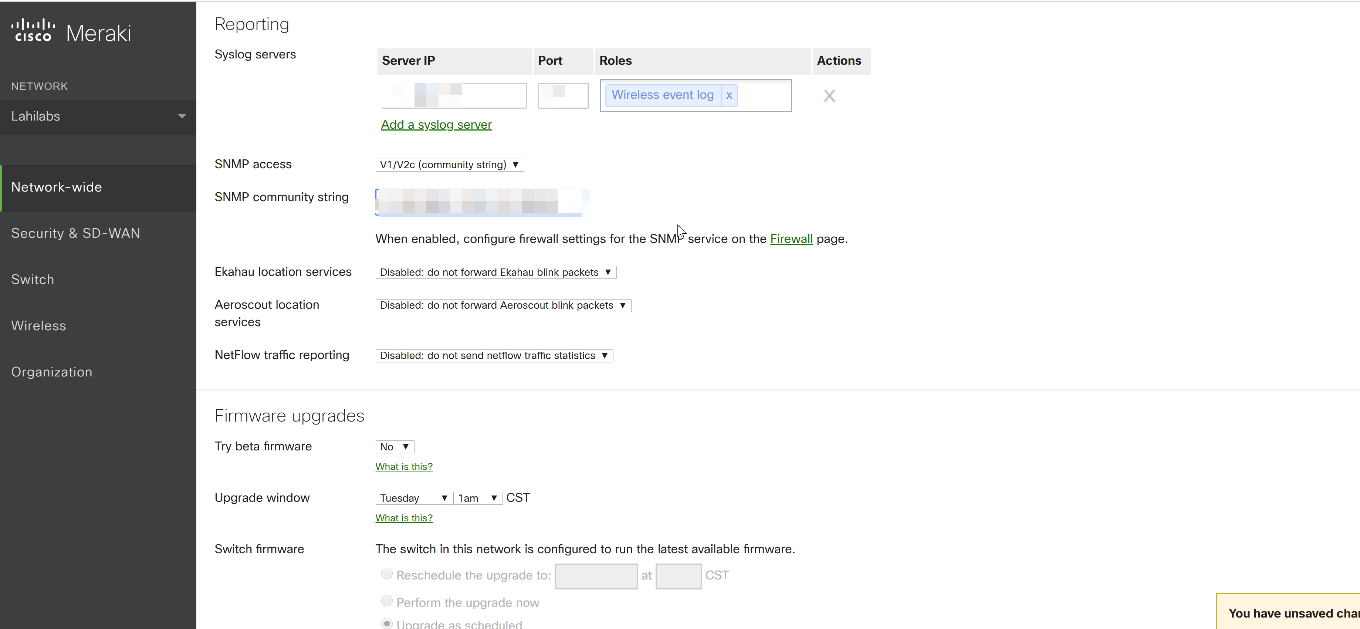
Change your community string to something secure. And Note that because we will need it later.
Step 2 : Configure your Datacollector
Note: This is a personal preference, you can do this on the same vm as the Grafana installation. Separation of duties is important to me.
I am using CentOS.
-
-
- Install Telegraf on this machine using these instructions: https://portal.influxdata.com/downloads#telegraf or follow instructions in this YouTube video : https://www.youtube.com/watch?v=f7DAKjYkA-Y&t=3s
- Install SNMP using this command
-
yum -y install net-snmp net-snmp-utils
This is a good guide as well : https://www.liquidweb.com/kb/how-to-install-and-configure-snmp-on-centos/
-
-
- Edit /etc/telegraf/telegraf.conf
-
Change these values :
[outputs]
[outputs.influxdb]
# The full HTTP endpoint URL for your InfluxDB instance
url = “http://yourinfluxdbiphere:8086”
# The target database for metrics. Telegraf will create the DB if it does not exist
database = “telegraf”
Now lets test our SNMP connection to the meraki MX65 Appliance using this command:
snmpwalk -v2c -cmystring 192.168.5.1.

We are getting Data from my MX65. Note those interfaces 1 to 12.
This information is getting loaded to a table called ifXTable. If you’re interested in reading more see : http://www.net-snmp.org/docs/mibs/ifMIBObjects.html
Lets check ifXTable for the data that we are getting : Use this command:
snmptable -v 2c -c yourstringhere 192.168.5.1 IF-MIB::ifXTable
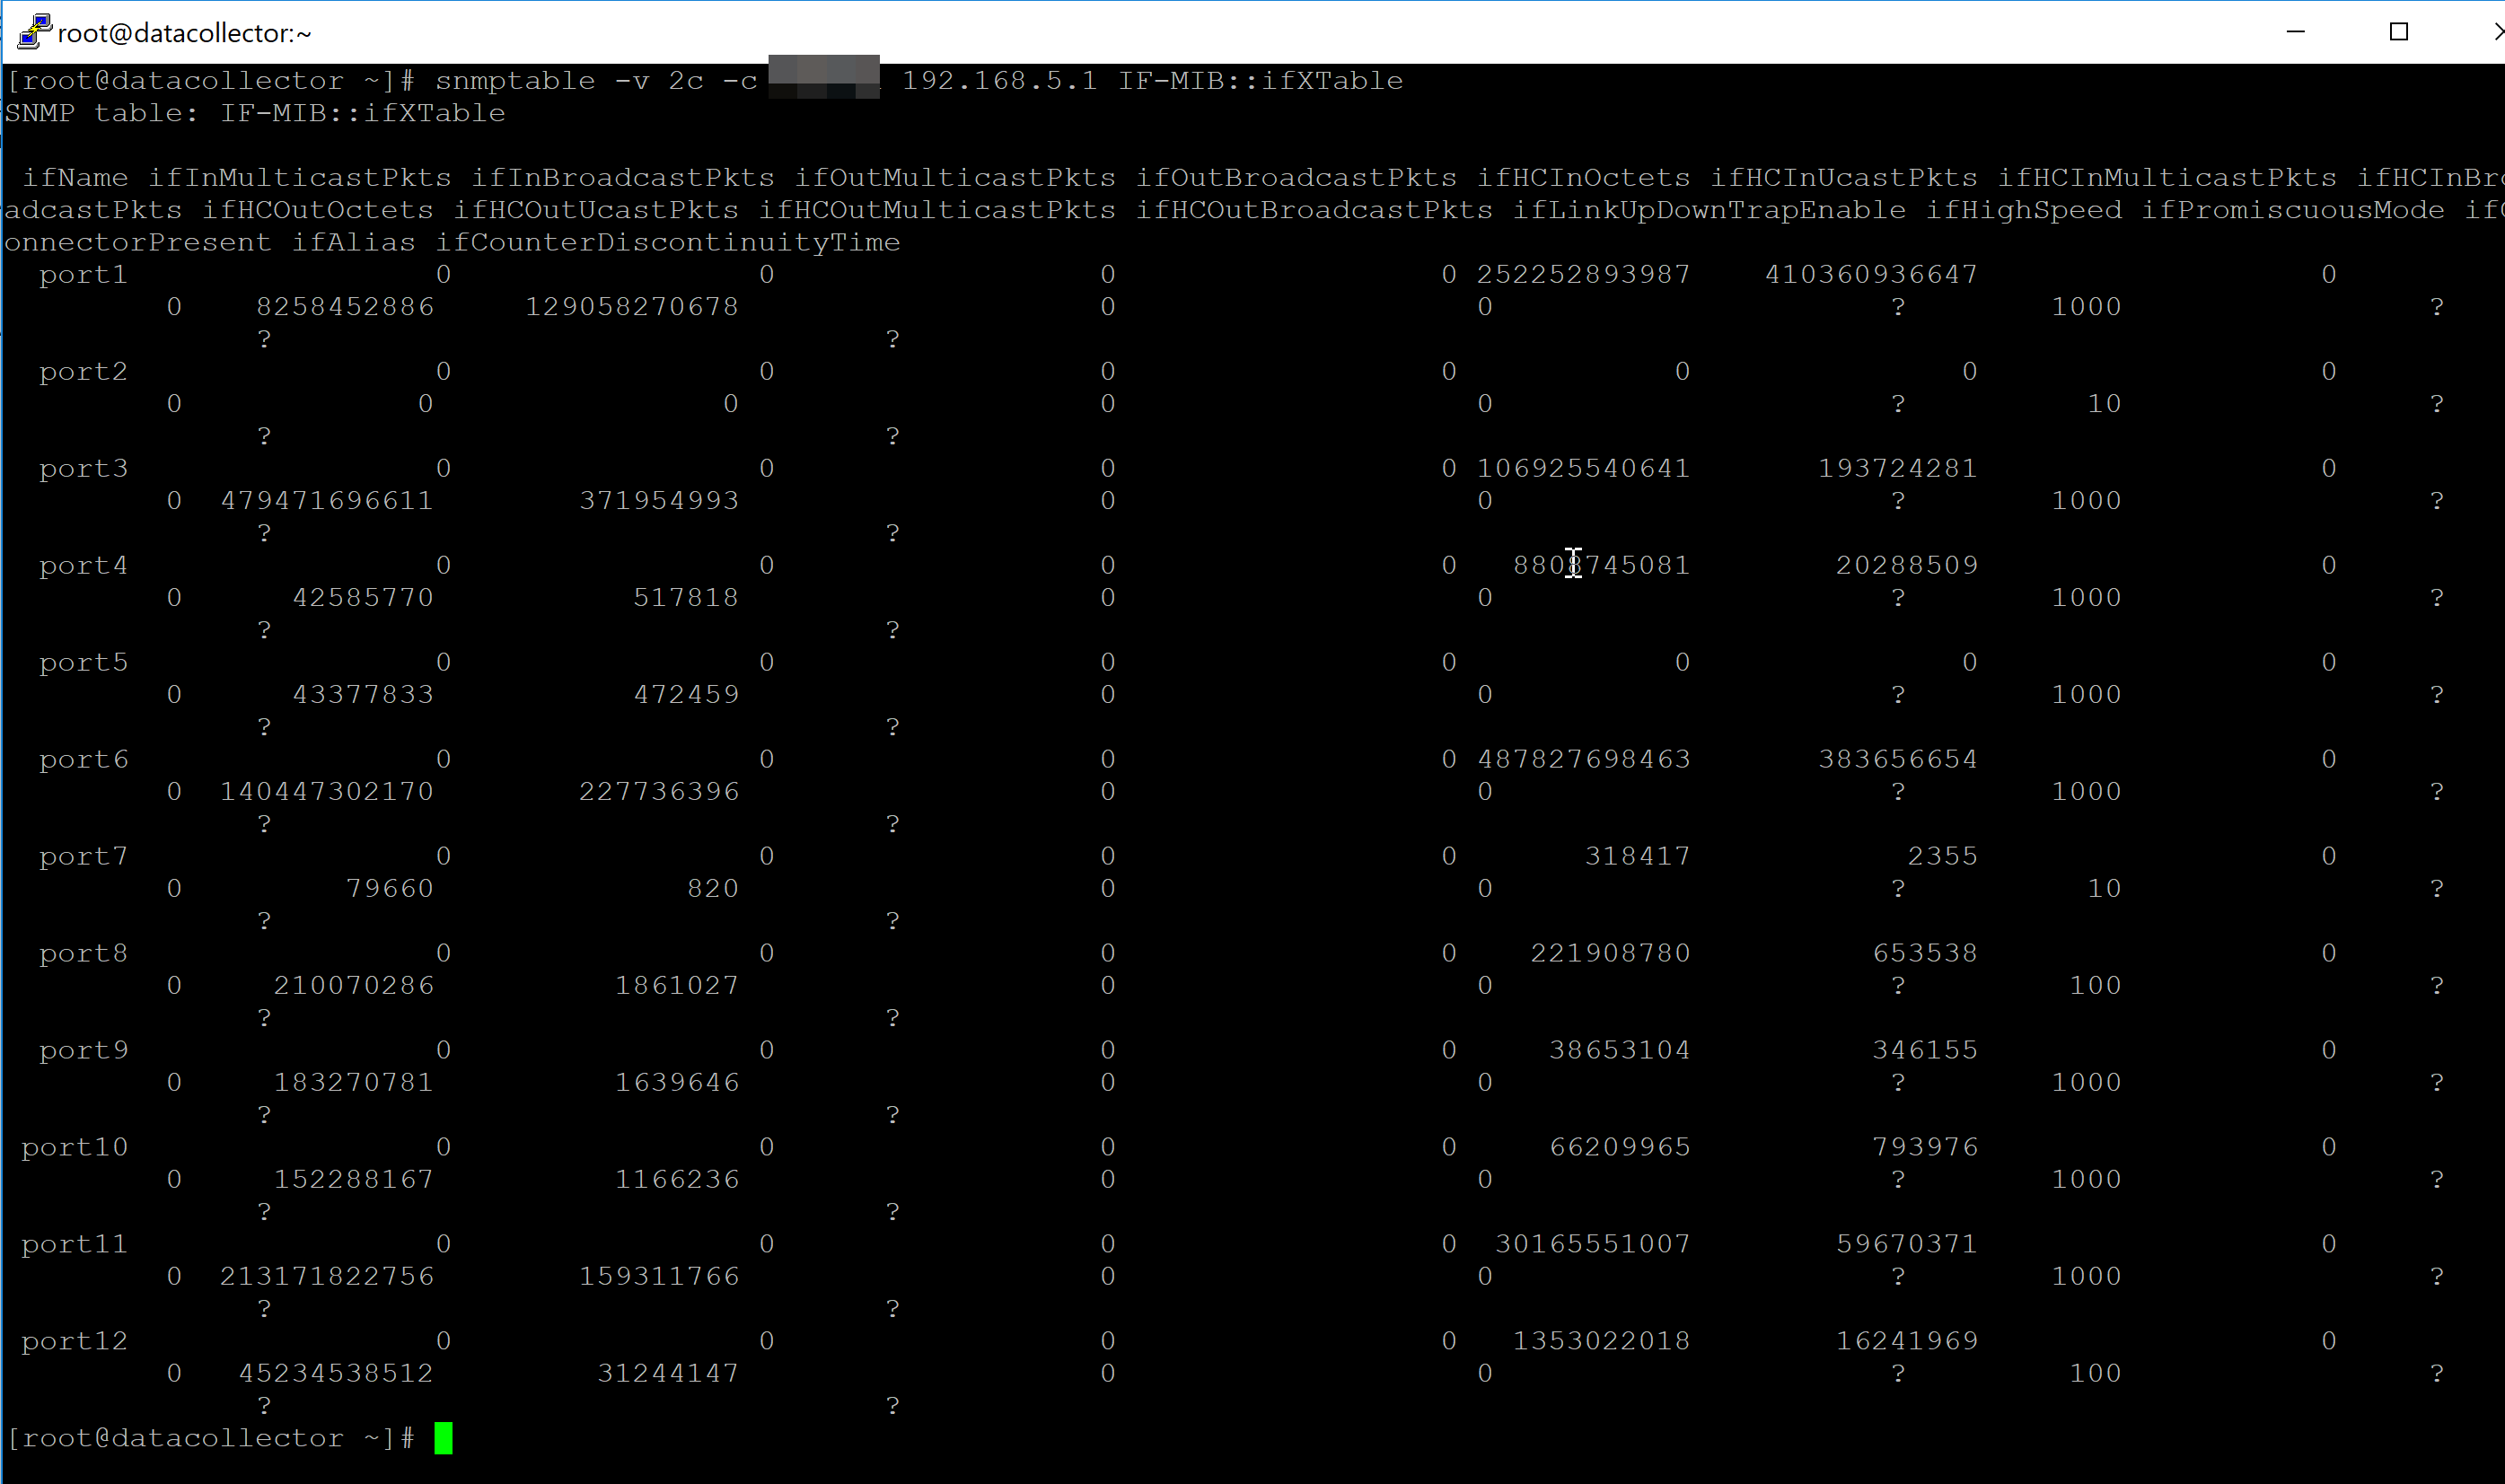
We are in business.All 12 ports are reporting for duty! That’s it for the metrics collector vm. We just need to add this data in influxDB so Grafana can grab it for graphing.
In your Telegraf.conf file, add the following in the SNMP section:
[[inputs.snmp]]
agents = [ “192.168.5.1” ]
version = 2
community = “yourstringhere”
name = “snmp”
[[inputs.snmp.field]]
name = “hostname”
oid = “RFC1213-MIB::sysName.0”
is_tag = true
[[inputs.snmp.table]]
name = “snmp”
inherit_tags = [ “hostname” ]
oid = “IF-MIB::ifXTable”
[[inputs.snmp.table.field]]
name = “ifName”
oid = “IF-MIB::ifName”
is_tag = true
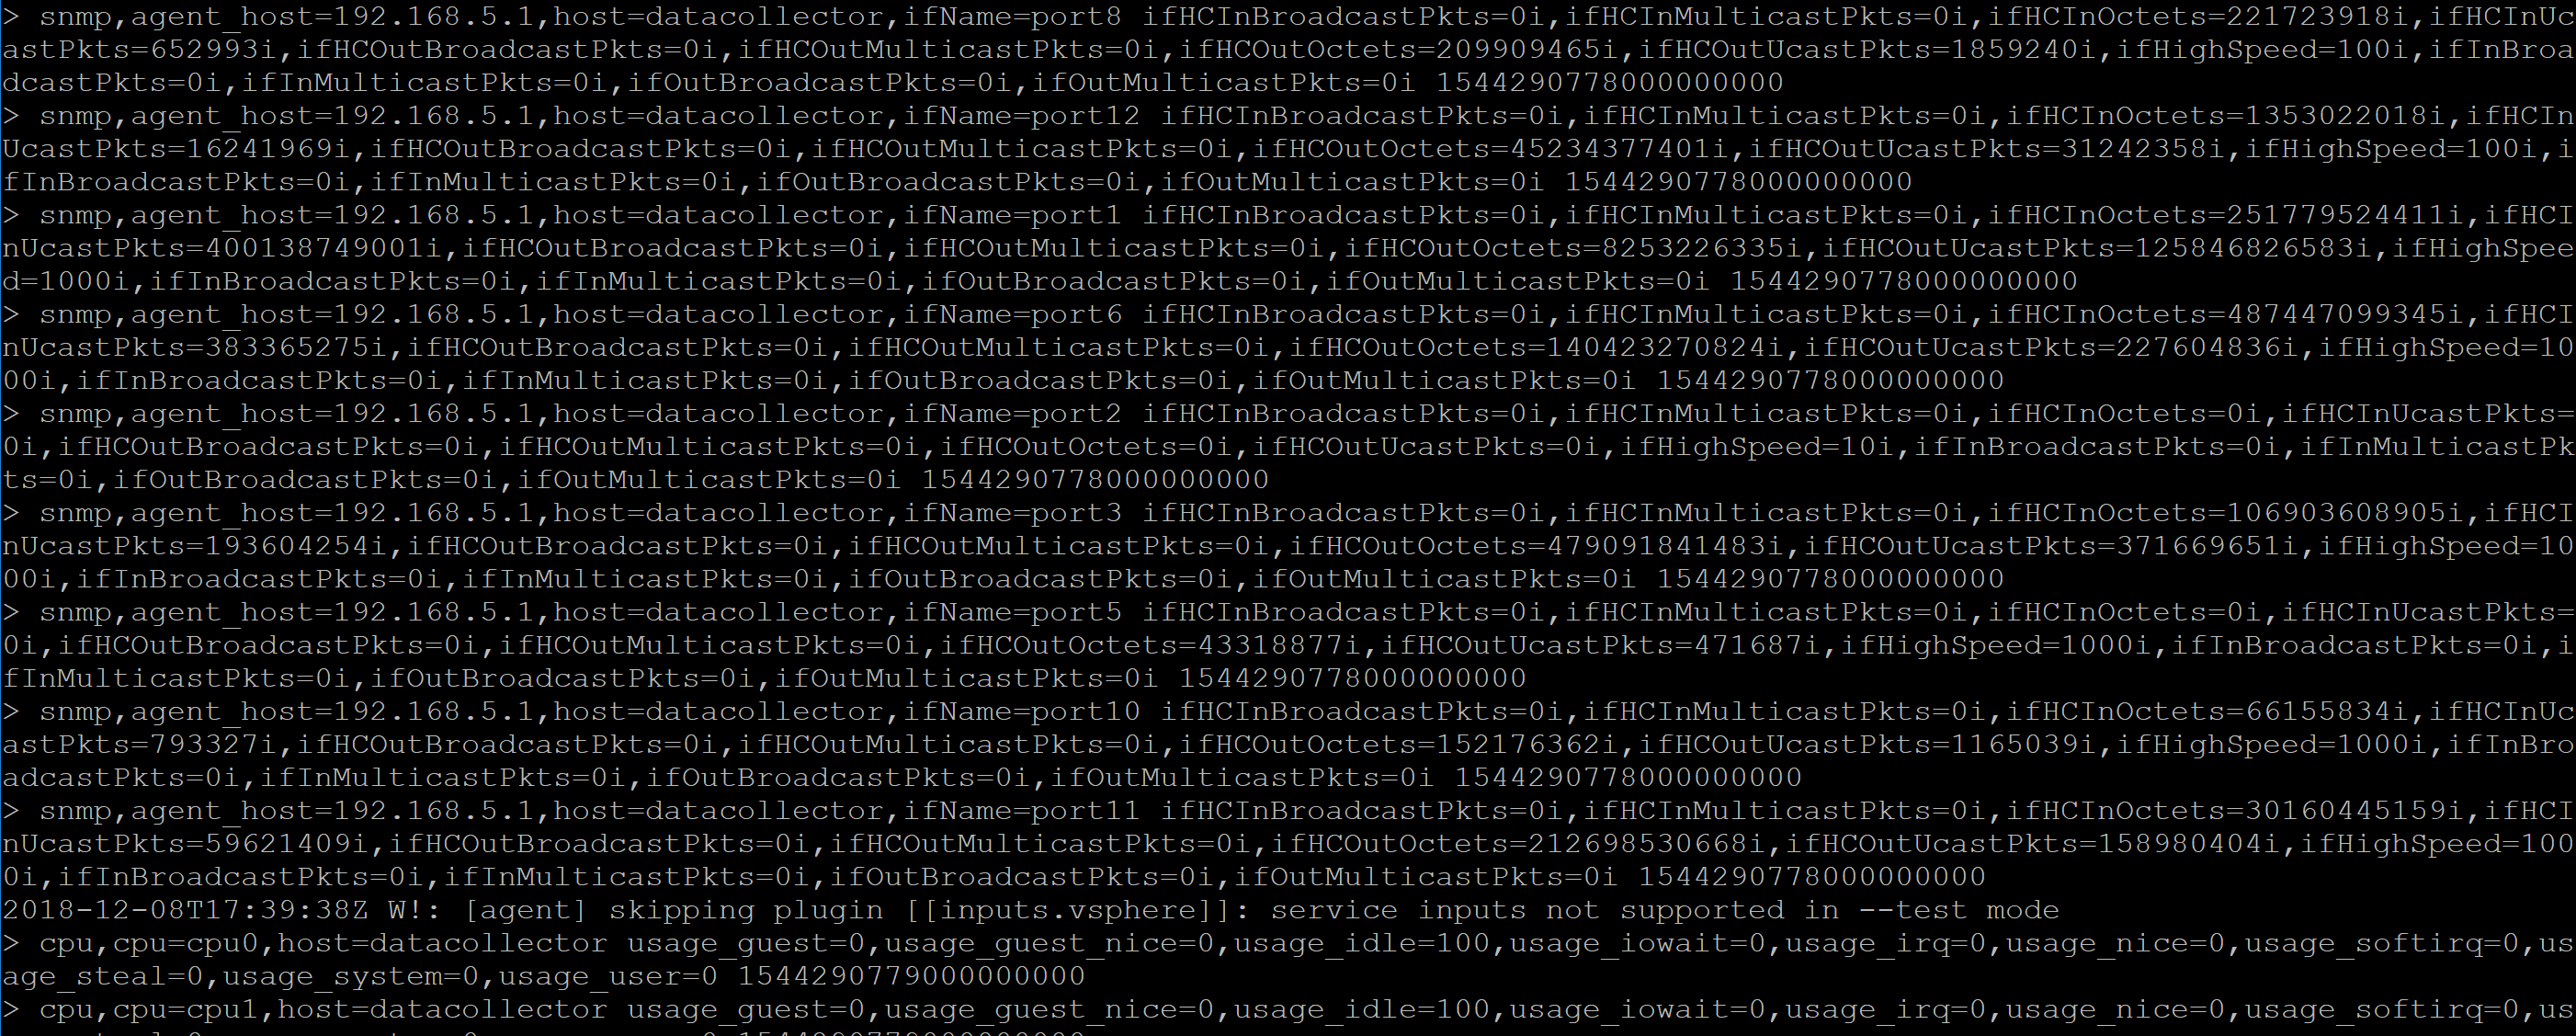
From this we will get these fields in our influxdb : hostname, ifName=, host, snmp, agent_host,host=192.168.5.1
***You can add more here. I just chose these for now.
Save and restart telegraf. Then test the configuration using the command :
telegraf –test. You should see something like this:
Now the fun begins. Graphs in Grafana!
Configure your graphs in Grafana
The data that we are getting is in Octects. We don’t do Octets, we like bits. So we just have to multiply the octets value by 8 since an octate consist of 8 bits. Curious about the Math? Read this:
https://en.wikipedia.org/wiki/Octet_(computing)
We are interested in two fields for this graph : ifHCInOctets and IFHCOutOctets. Furthermore, I only want these values for the WAN interface, which for me is interface 1, so this is what I have for the query:
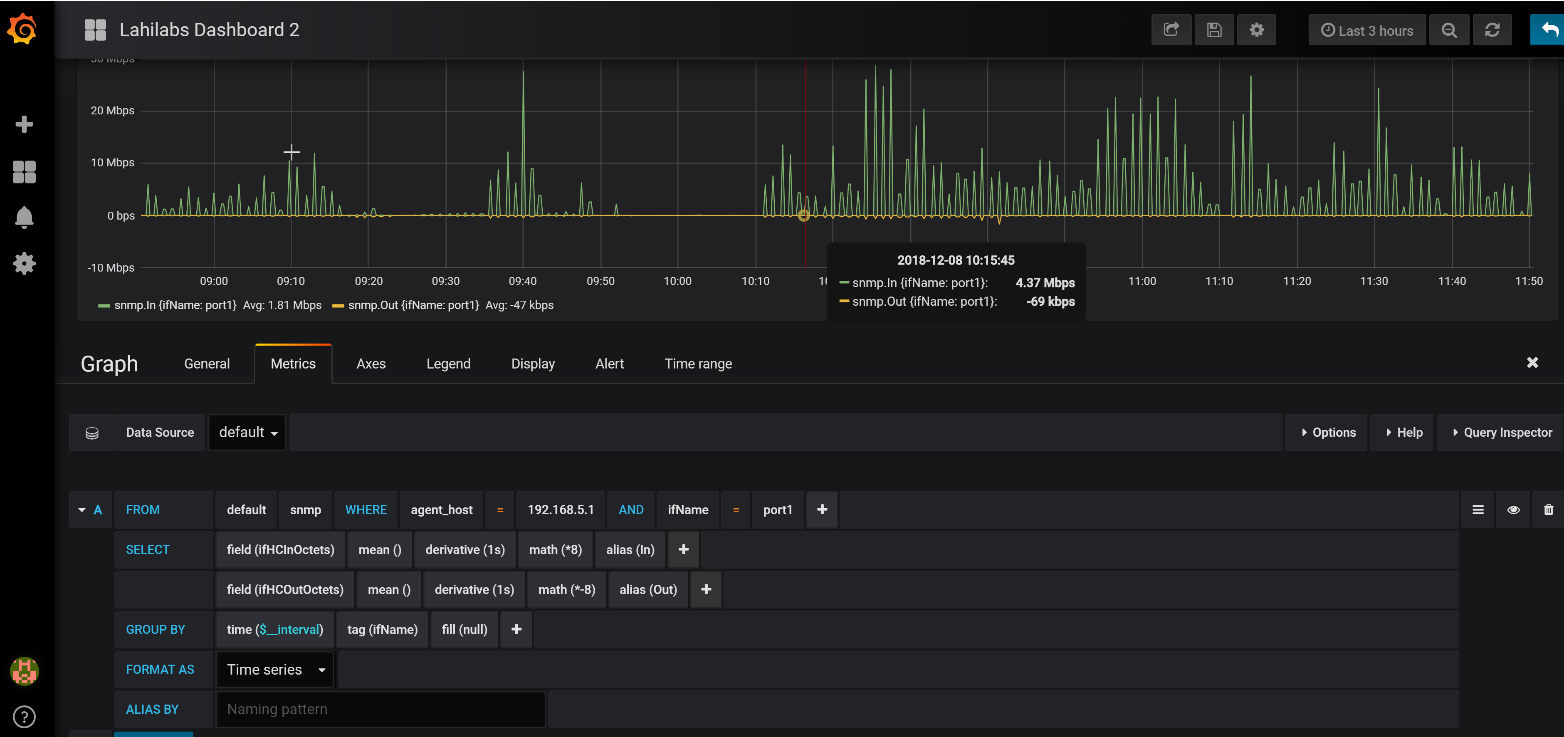
From here, the sky is the limit. You can create graphs for any interface, get alerts from Grafana and add this to your existing dashboard so you don’t have to keep signing into the meraki dashboard.
Check out my youtube video for a live demo of this setup.
Let me know bellow if you have any questions. I hope you find this helpful.
Happy graphing.