How to graph IDRAC temperature, power usage and fan speed measurements in Grafana
In this tutorial I will show you how to get your Idrac sensor metrics into Grafana in no time. It’s a simple and straight forward process that took me an hour, mostly because I had to research it. It should take you no later than 20 minutes. The metrics that I will be sending to Grafana are :
- Temperature (Celsius)
- Power (Watts, voltage, amps)
- Fan Speed (rpm)
Requirements:
- A working Grafana, influxdb, and telegraf installation (optional, data collector virtual machine with telegraf) See my youtube video here on how to install all these in docker for testing in 10 minutes : https://youtu.be/xWnI3sHMbGI
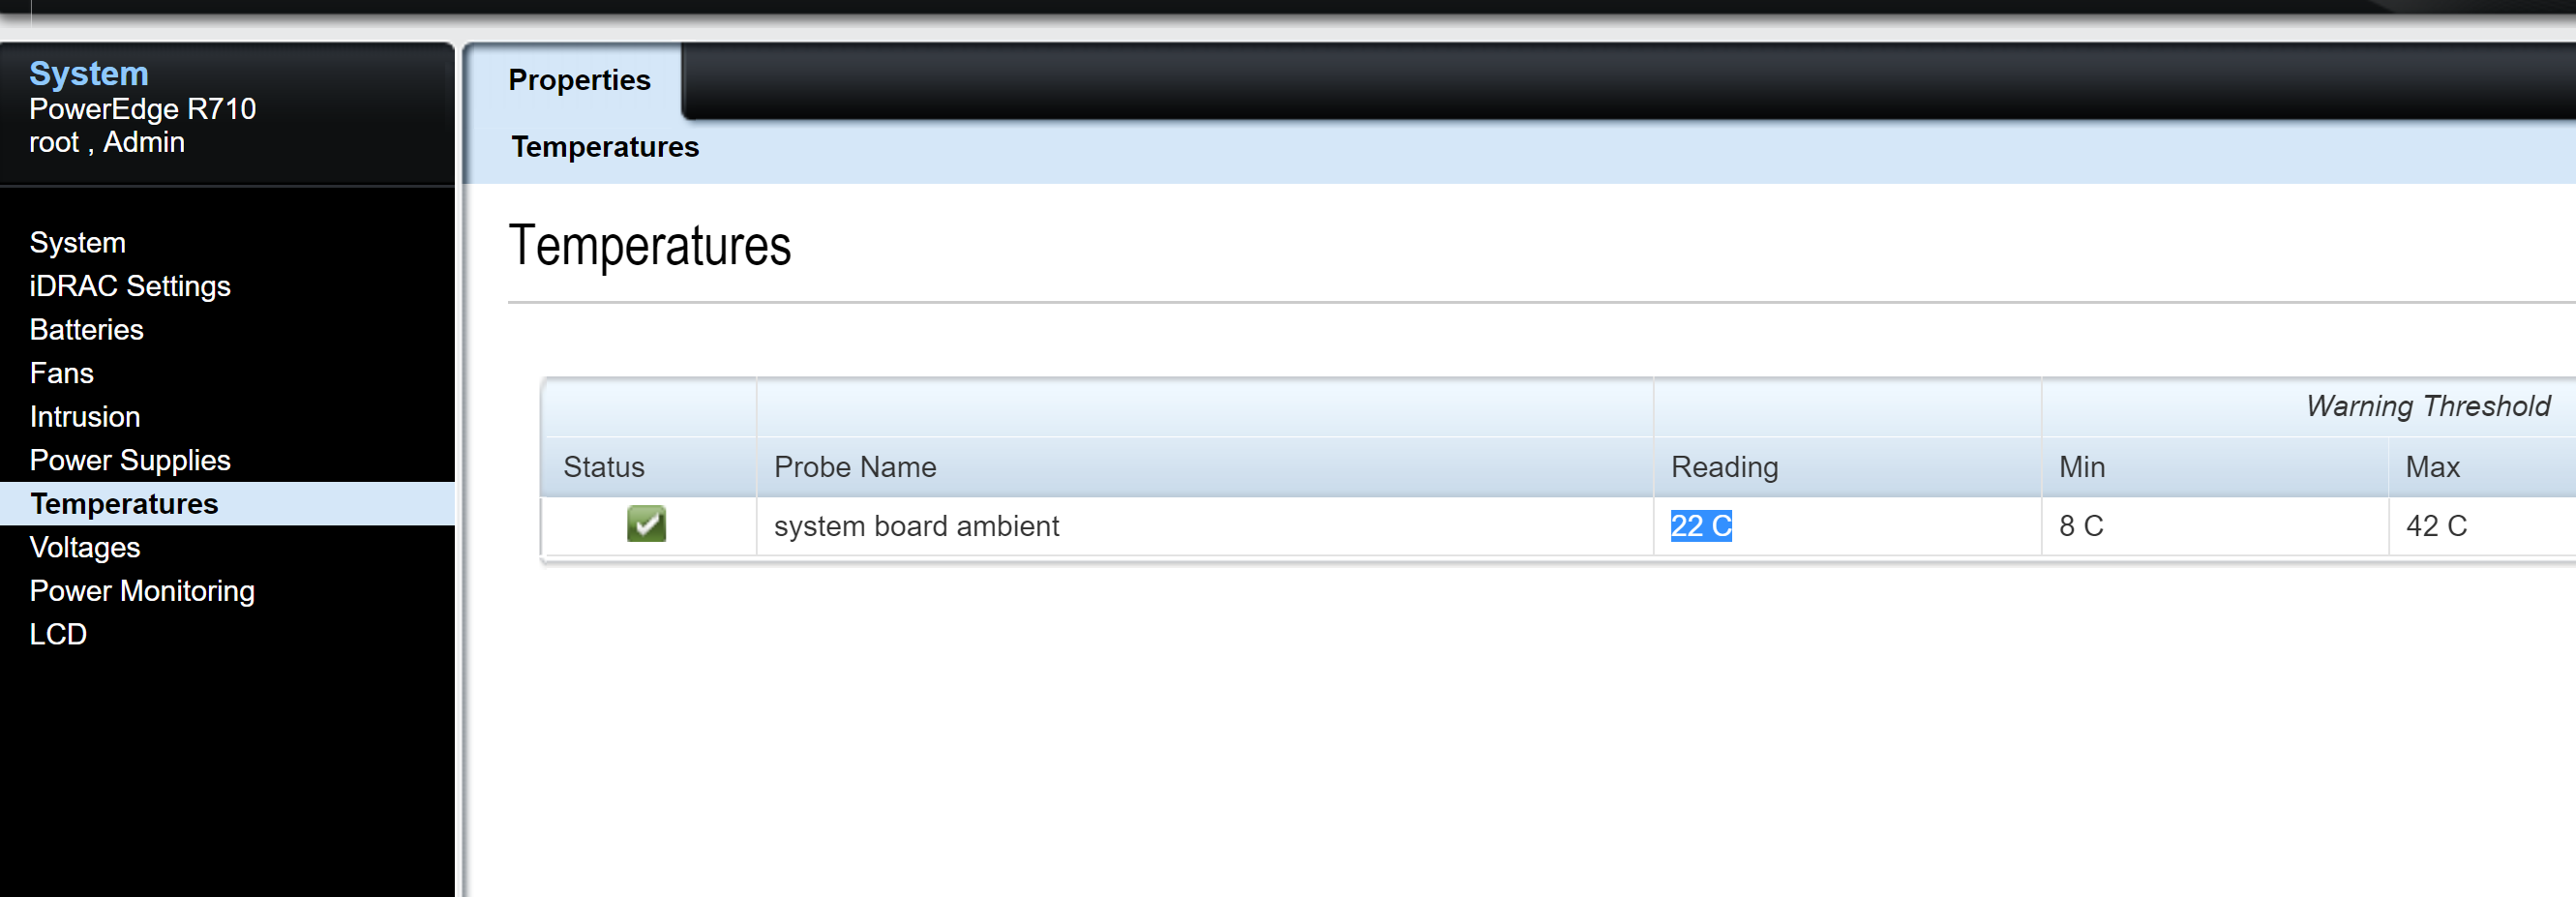
- Idrac express (in my case) or enterprice enabled on the server with access to the web GUI (to verify the metrics once we get them to Grafana. Instructions on how to enable Idrac on Dell servers can be found here: https://www.dell.com/support/article/us/en/04/sln85612/how-to-setup-and-manage-your-idrac-or-cmc-for-dell-poweredge-servers-and-blades?lang=en
Step 1
In my metric collector vm (or whatever vm you installed telegraf) install openIPMI and IPMI tools . I am using centos so I used these commands command:
yum install OpenIPMI OpenIPMI-tools
chkconfig ipmi on
service ipmi start
You can get also run the command bellow to learn more about how to use IPMI
# IPMI commands
ipmitool help
man ipmitool
Step 2
Test to make sure that you can connect to your idrac server from your telegraf machine.
Ping 192.168.5.100 (for me) ## This could have saved me time when I was setting mine. Just do it.
# ipmitool -I lanplus -H 192.168.5.30 -U root -P yourpassword sdr -v
If idrac is setup and IPMI is working, you should see something like this:
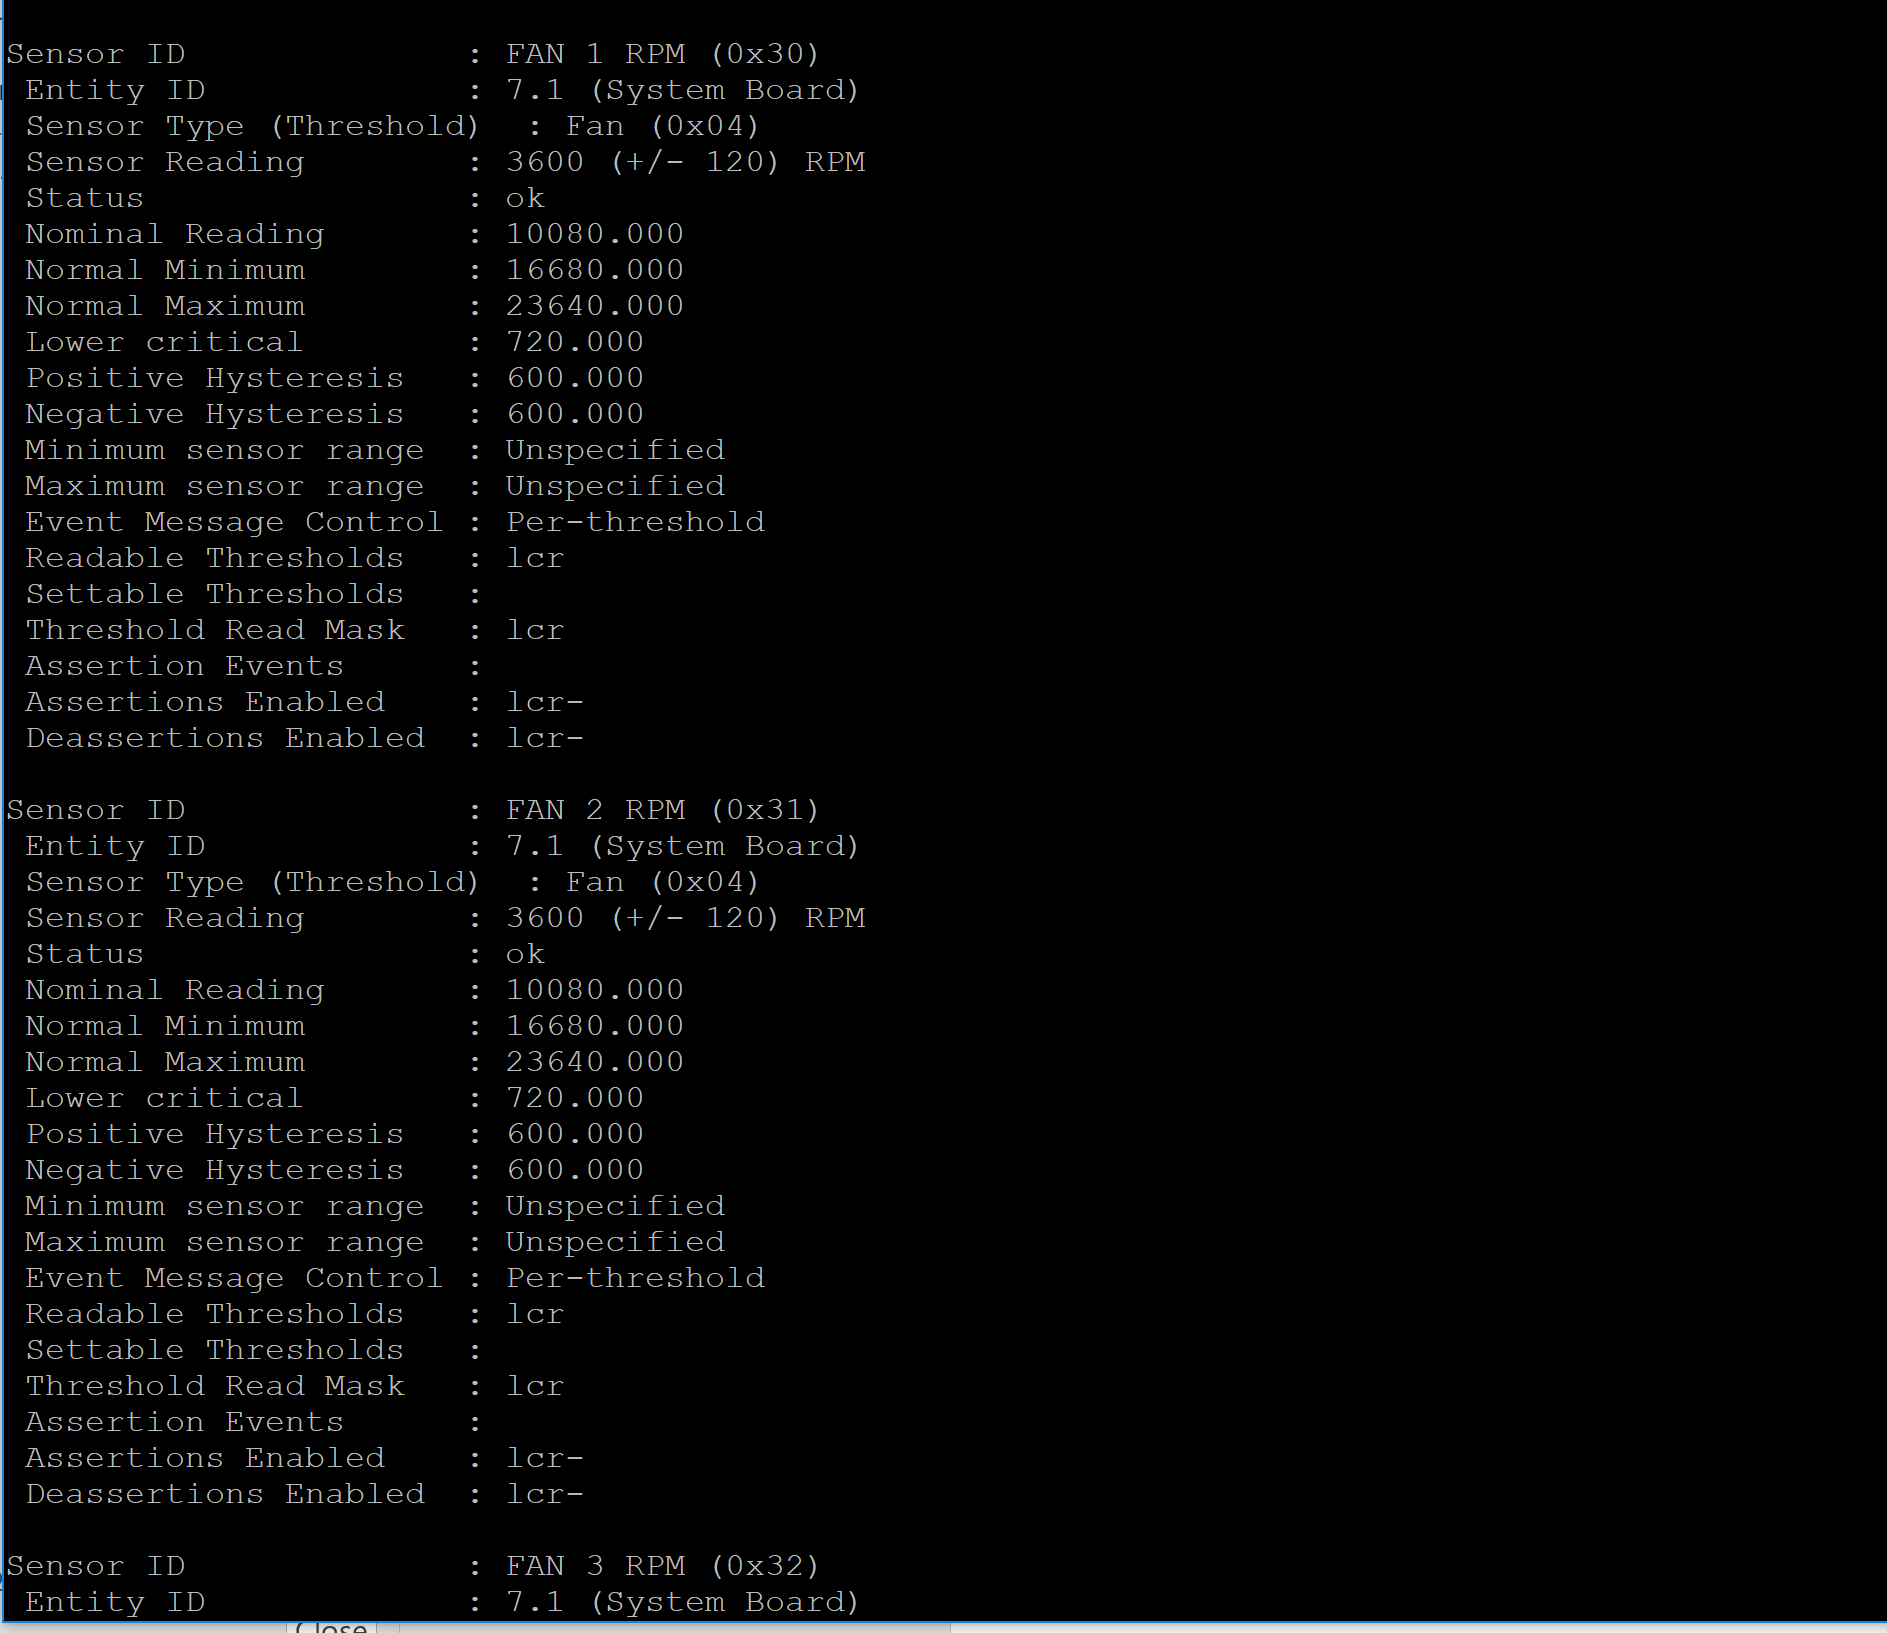
You can see fan info, so we are getting data from idrac, next we need to configure telegraf to send this info to InfluxDB so Grafana can grab it.
Step 3
On your telegraf vm, edit the telegraf.conf file and uncomment the ipmi info as bellow:
Use your own serverip, root, and password
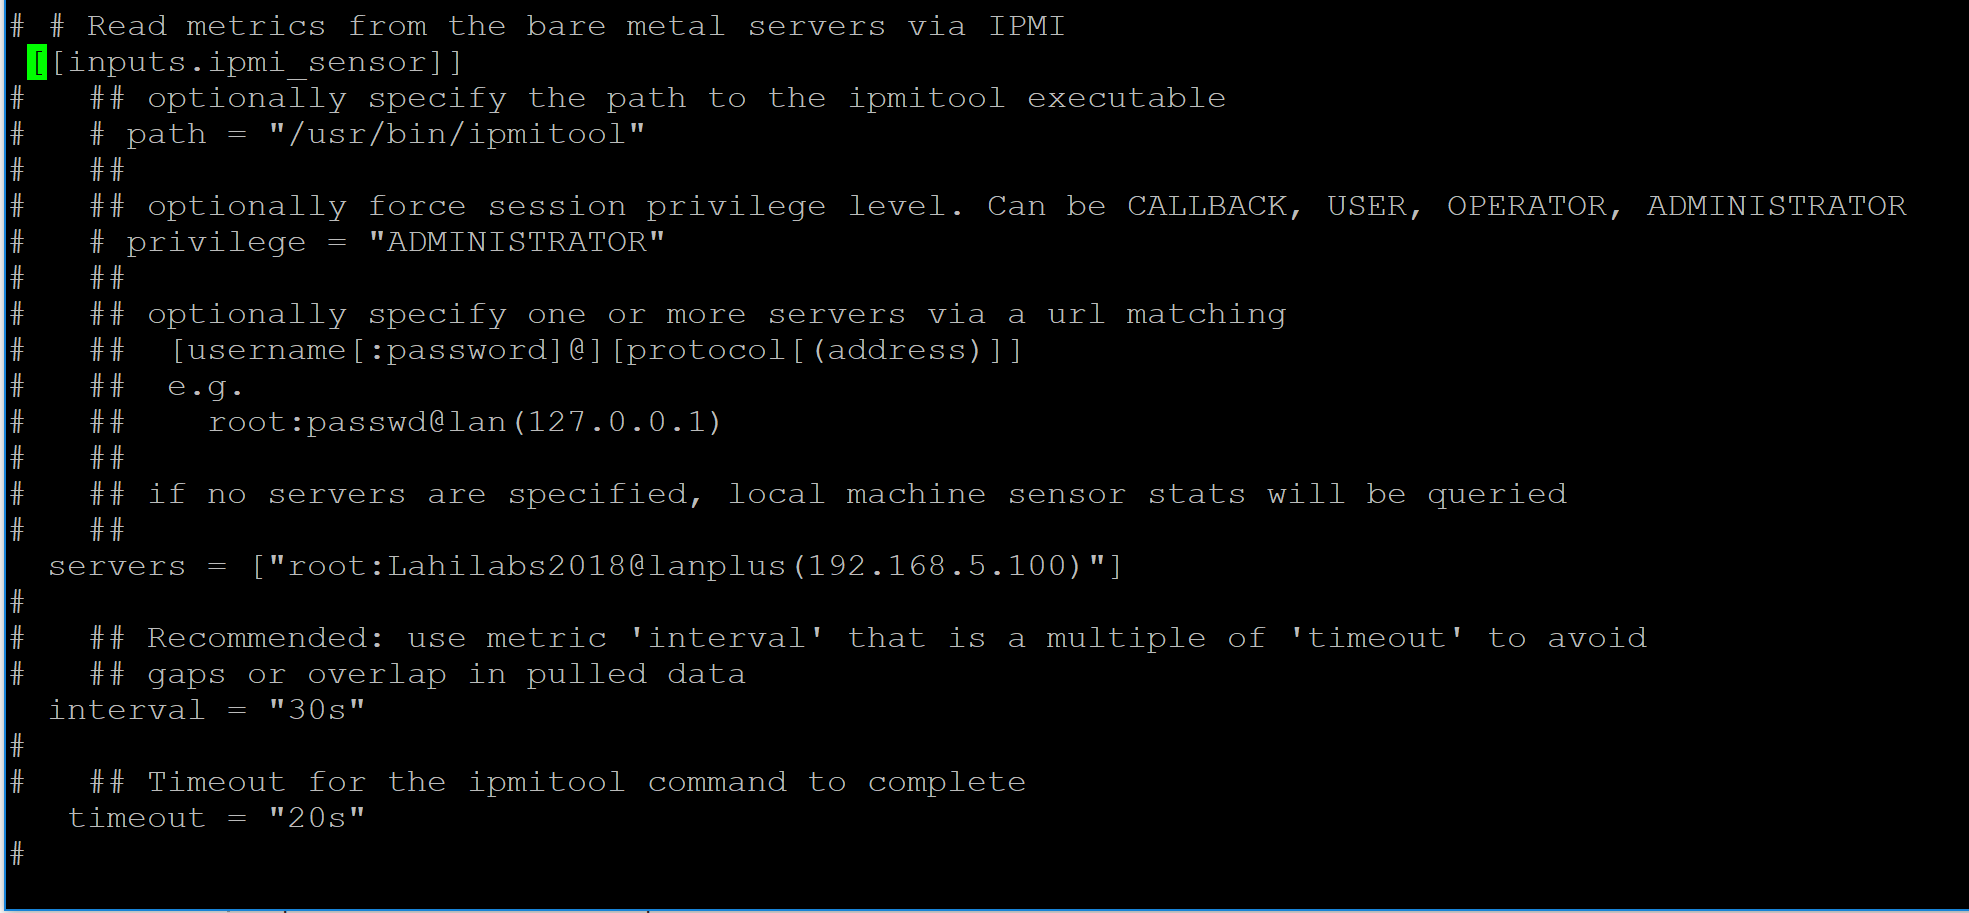
After this, restart telegraf and you will have this data in Grafana.
Step 4
Sign into Grafana web GUI and create a new singlestat dashboard. To get this data, select the values as follows,
Ipmi_sensor, server, and unit.
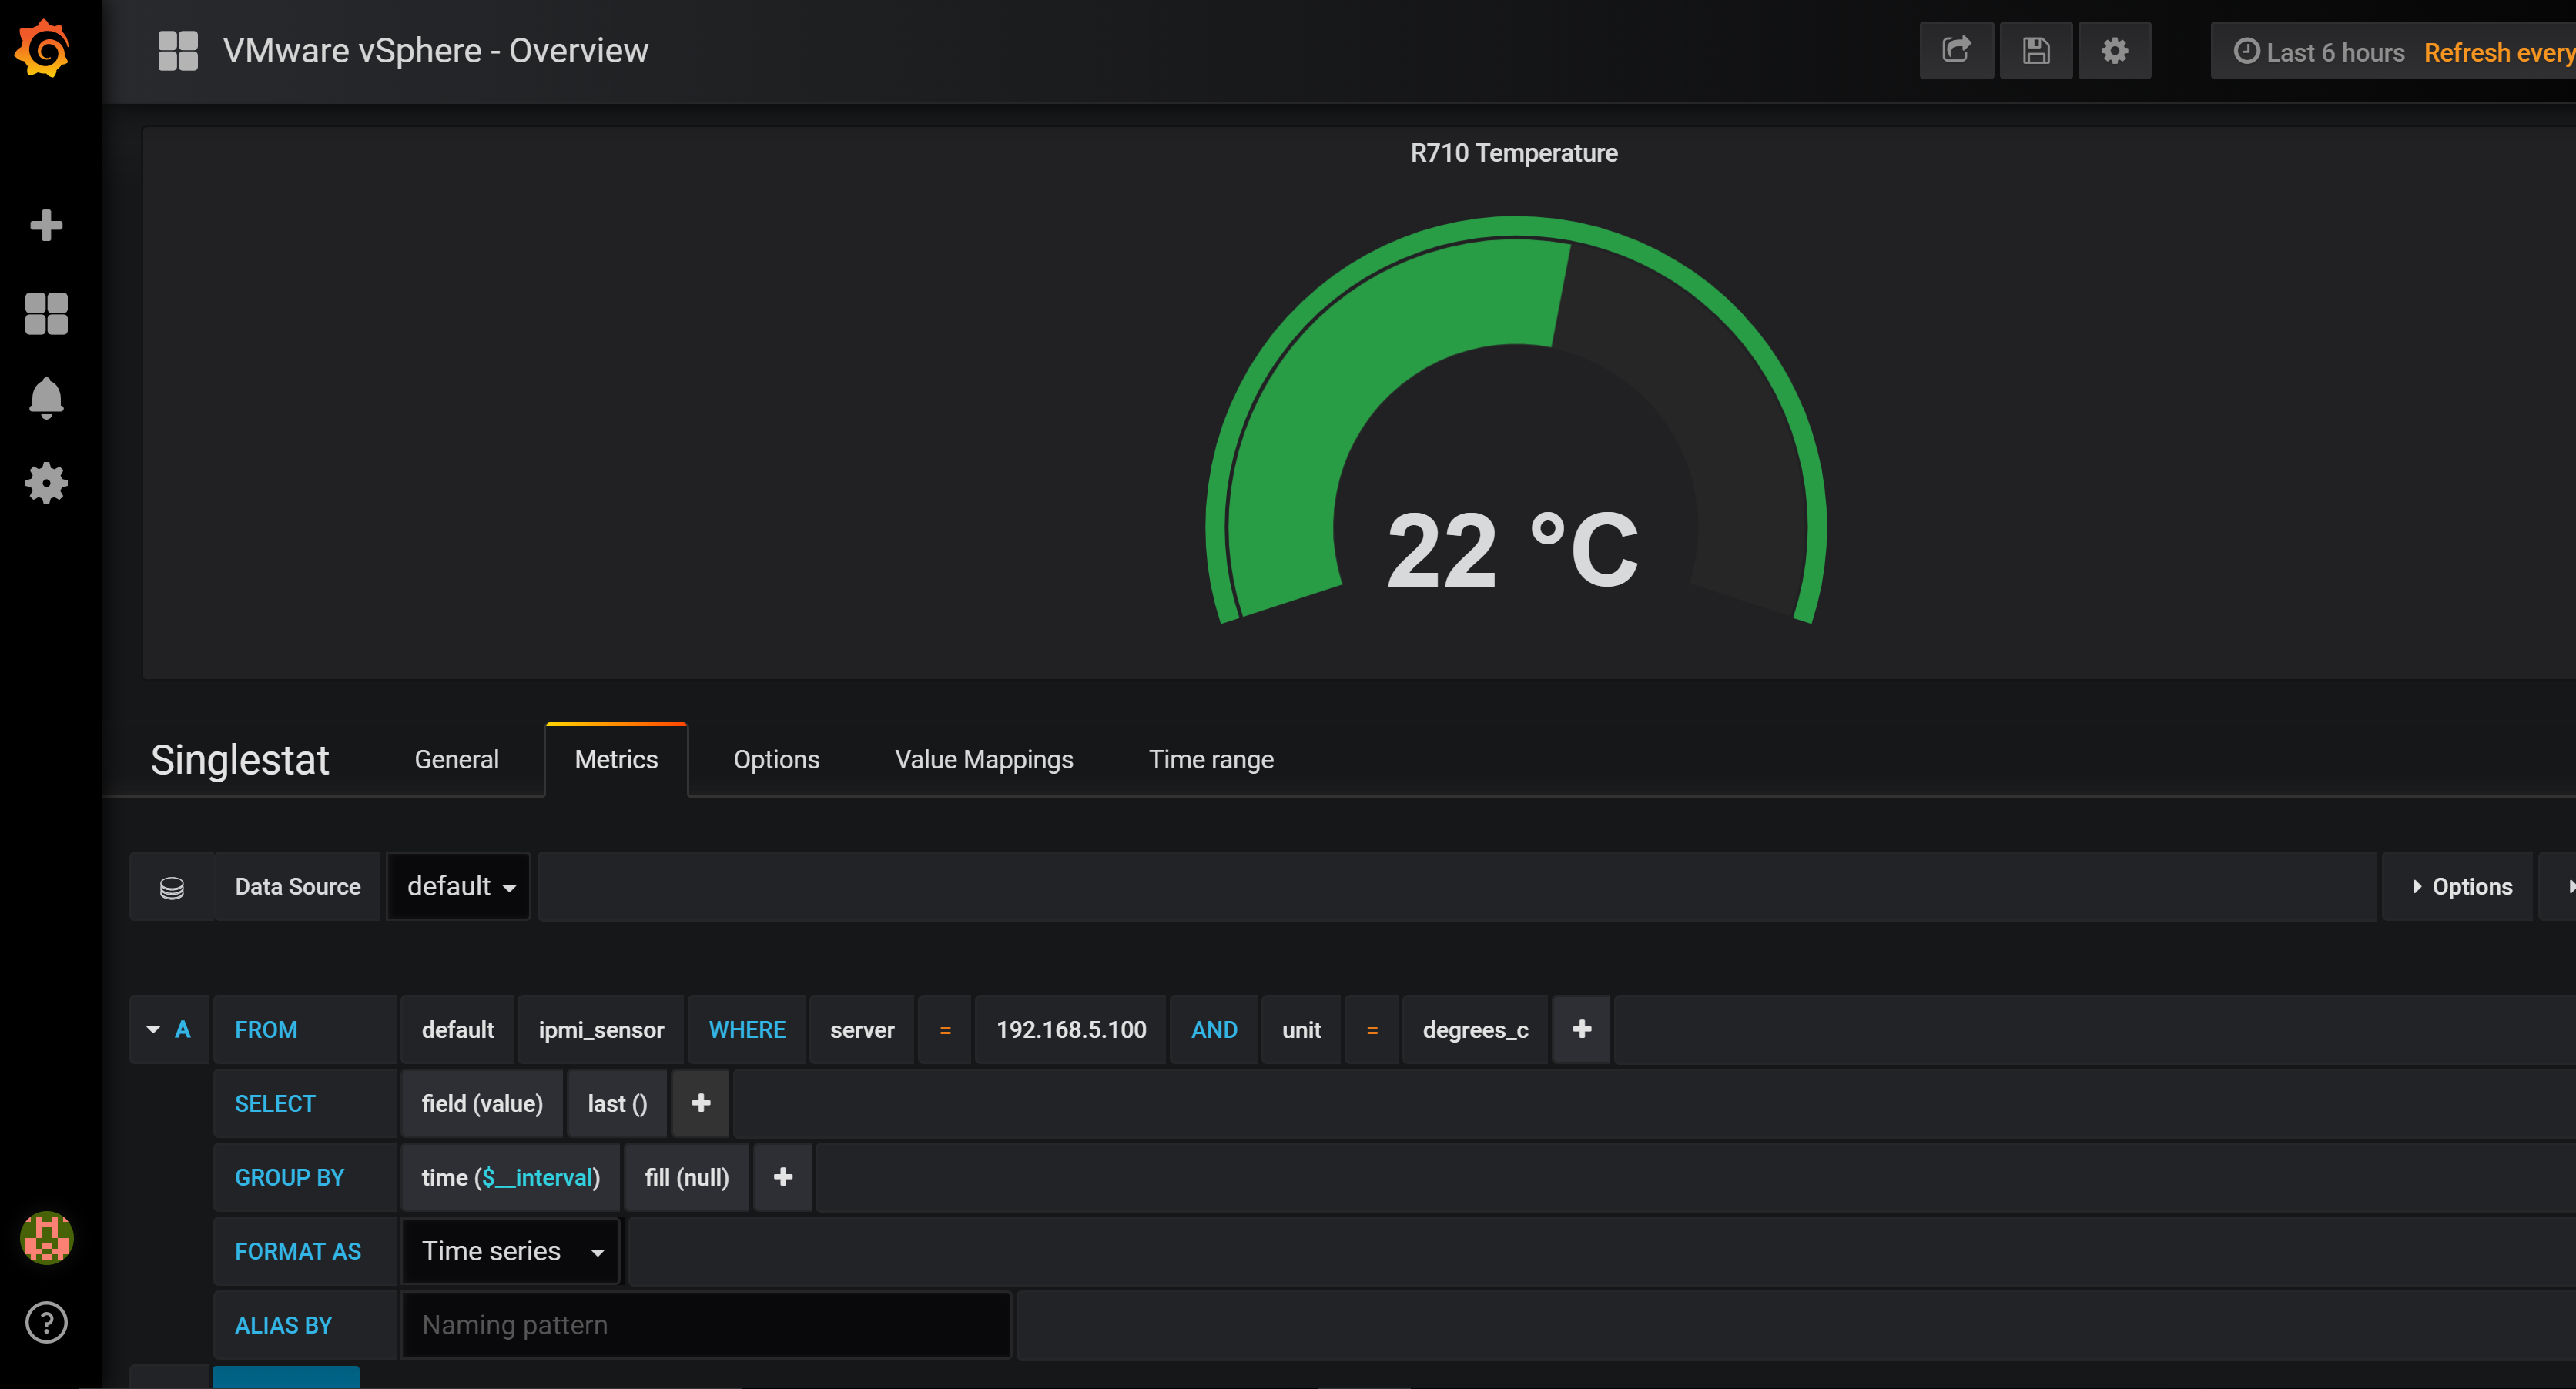
That value matches my idrac reading as well:
See my youtube video here for a video of me setting up this and the power dashboards as well graphing the wattage, cost etc. The graphs are fun to look at.
https://www.youtube.com/channel/UCXPdZsu8g1nKerd-o5A75vA?view_as=subscriber
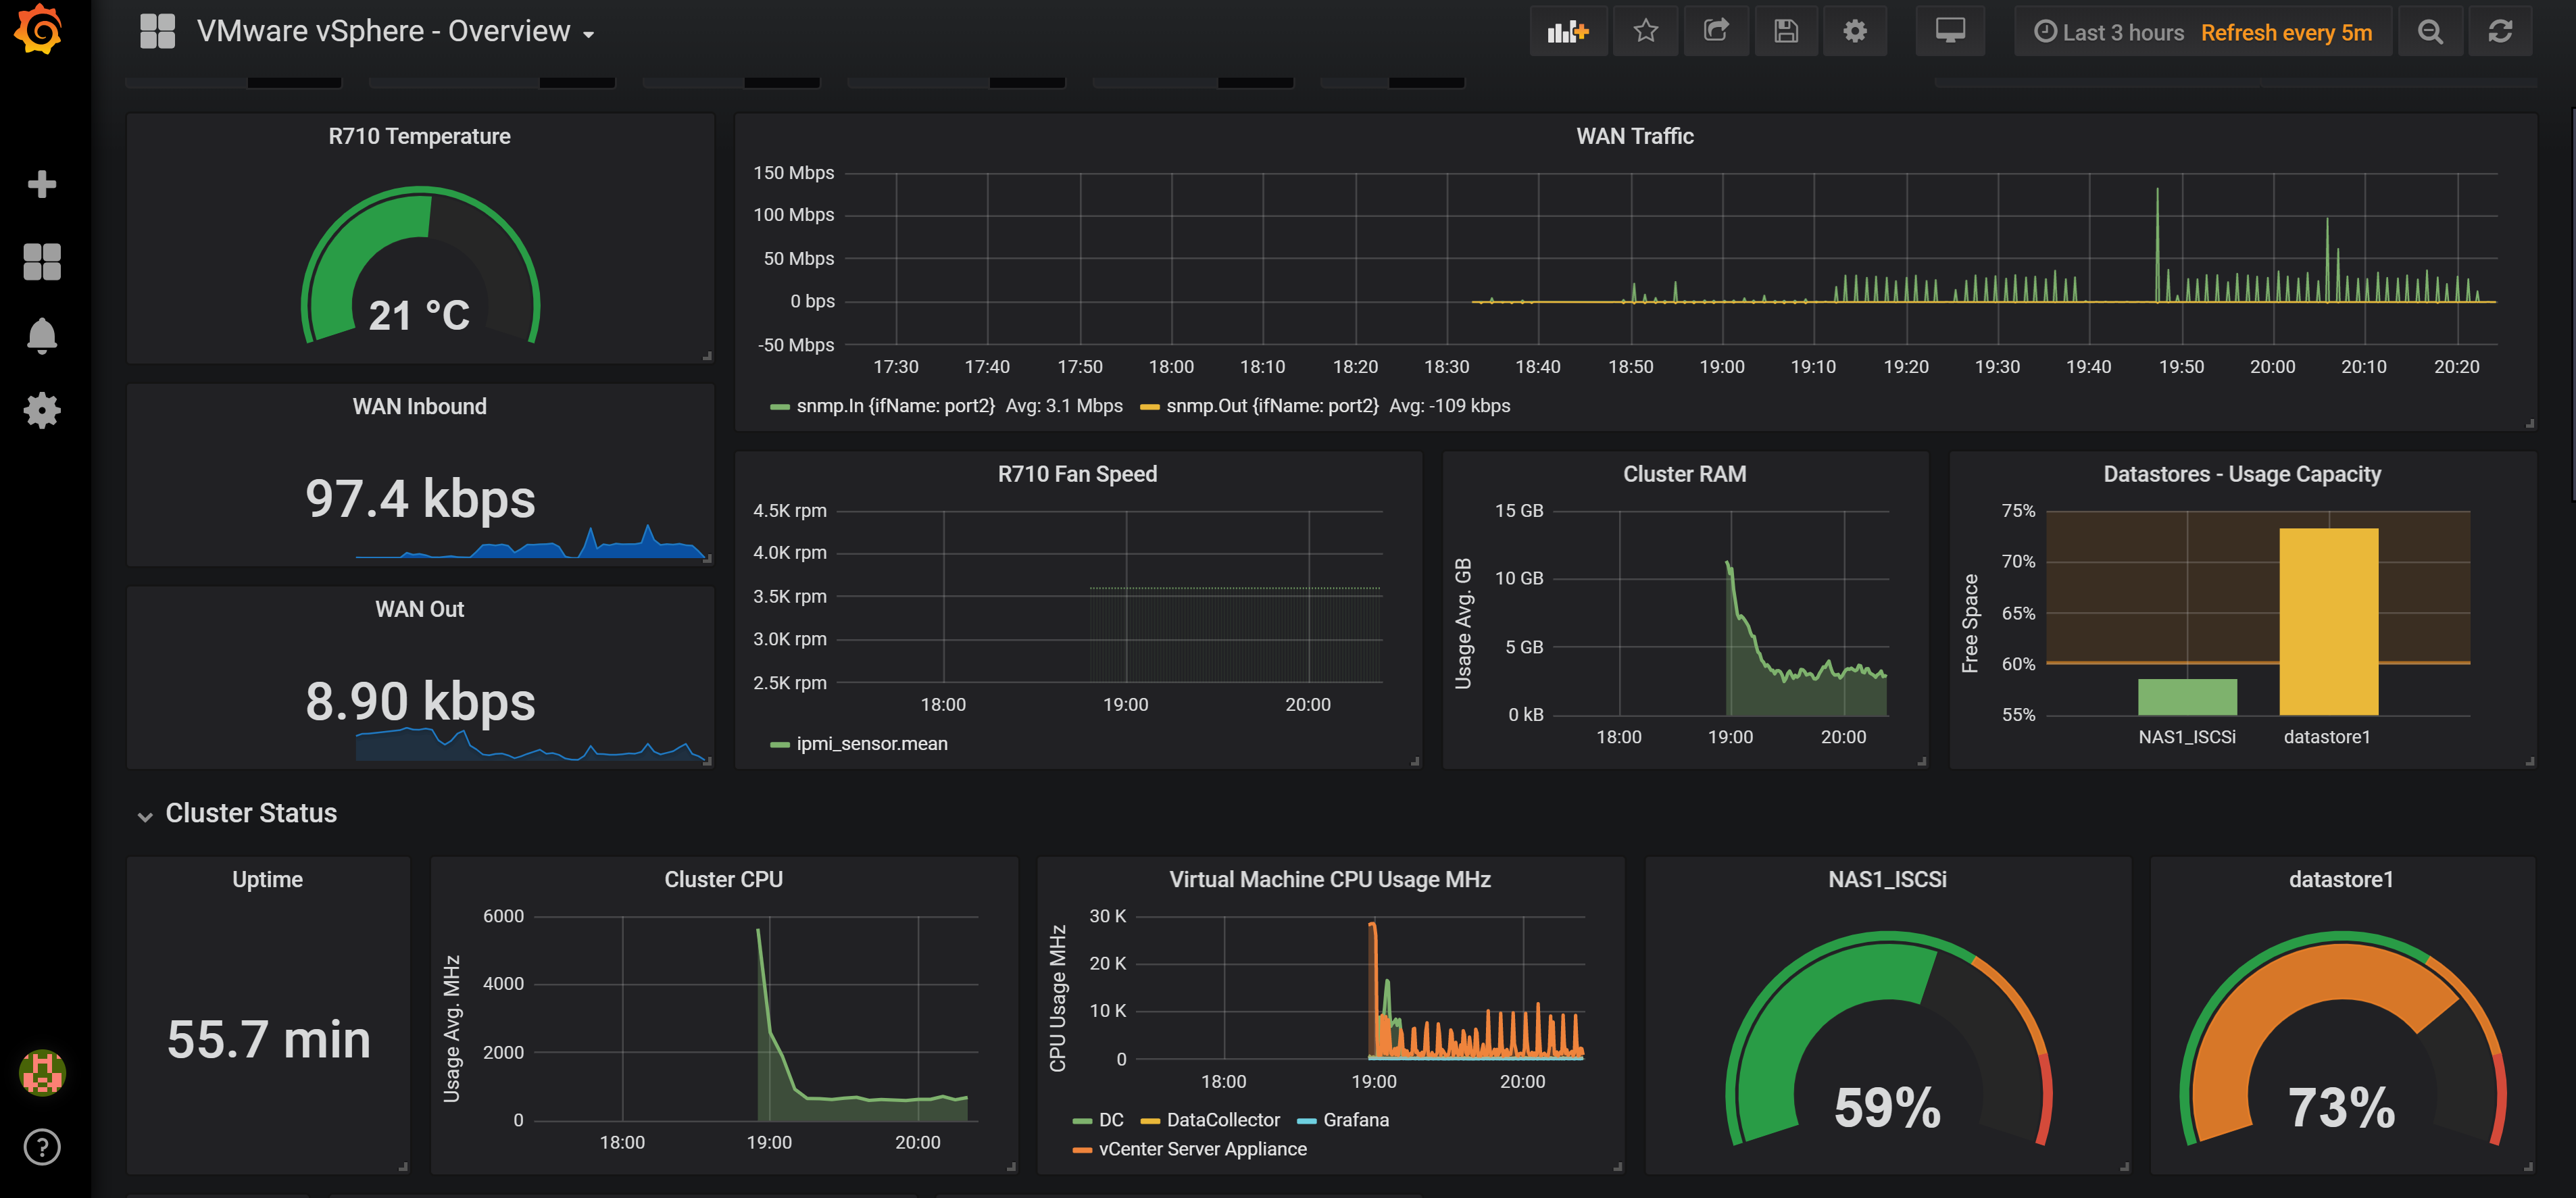
Almost final graph;
As always, leave a comment bellow and happy graphing.
