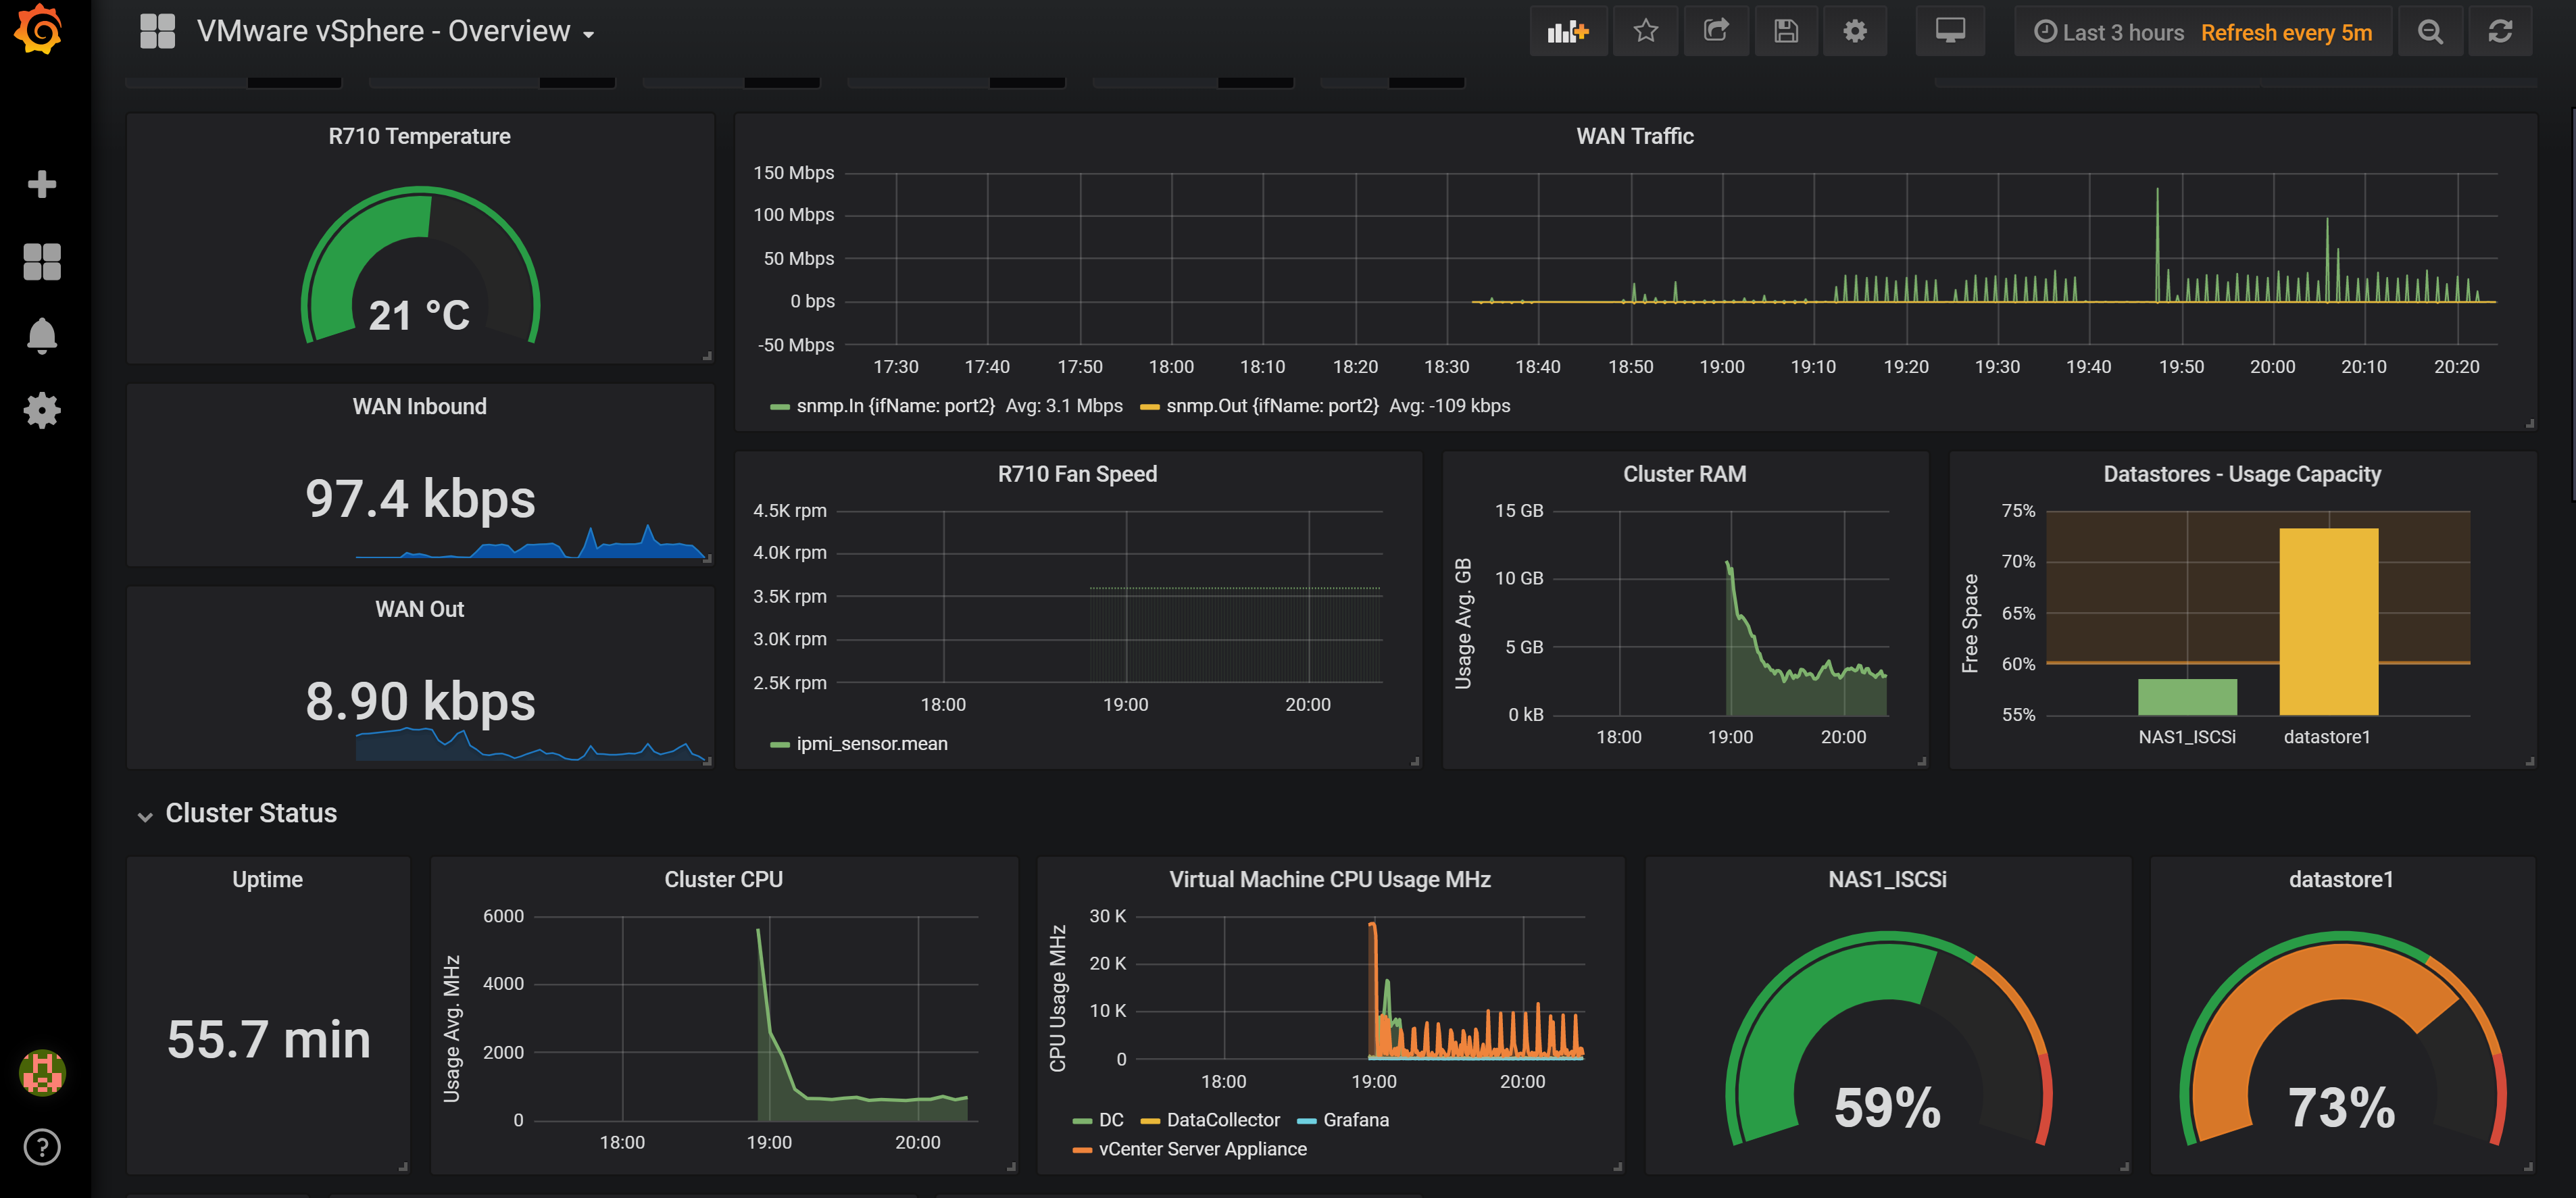
How to Monitor SNMP devices with Telegraf and InfluxDB and Grafana | Meraki WAN Data

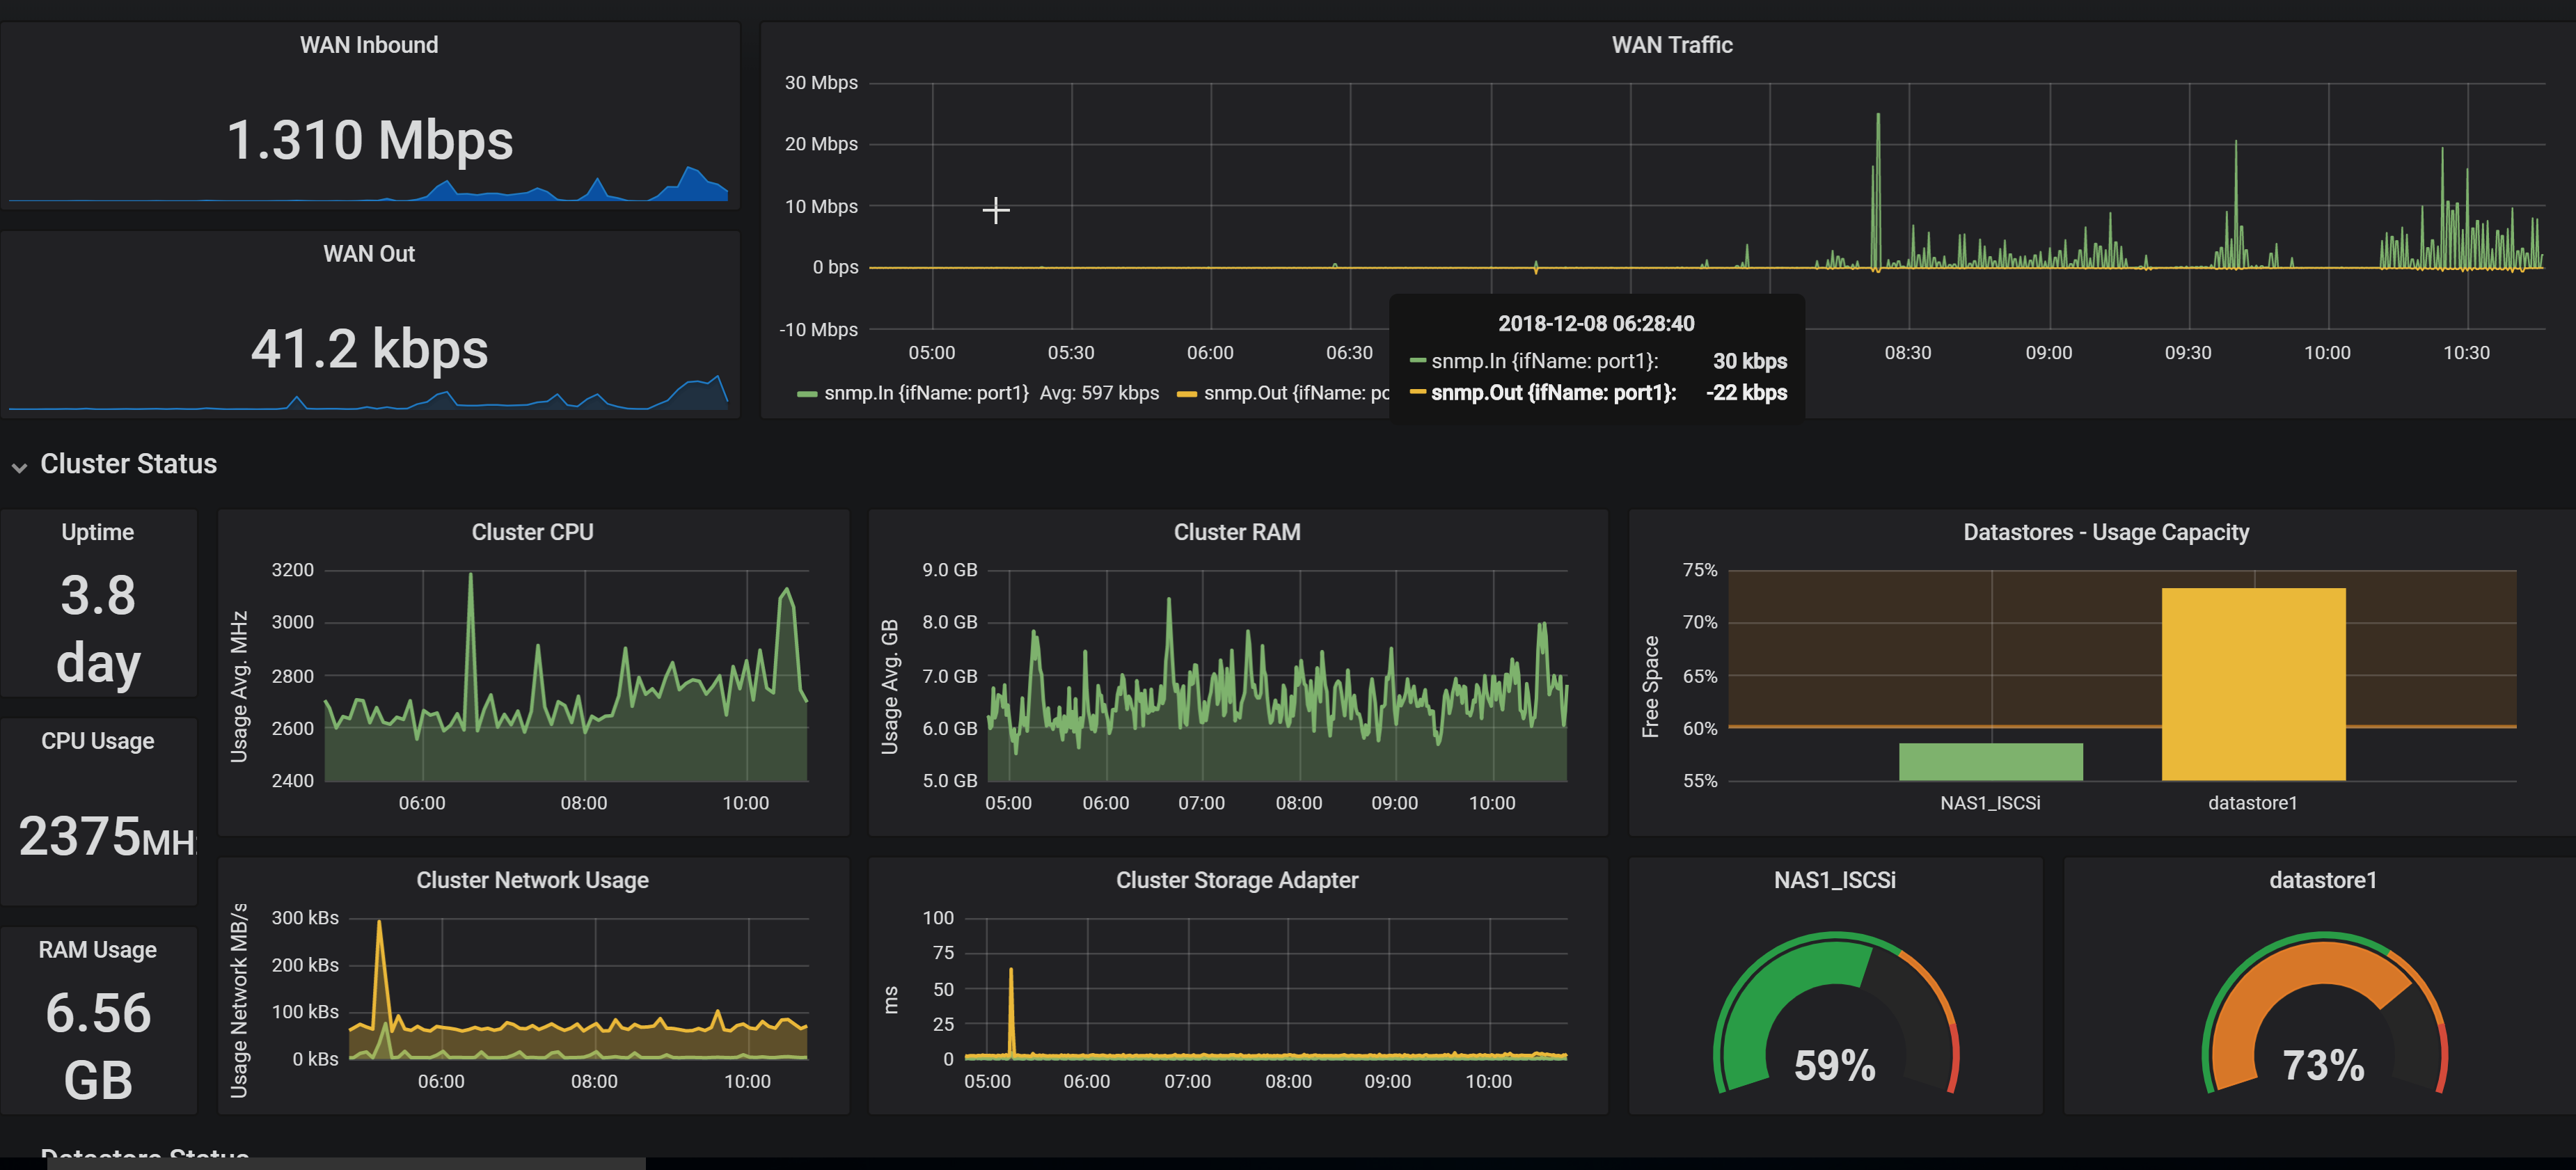
Why did i write this... Every IT admin needs to know what is going on in their environment at all times. Having a dashboard in your office on a TV and active alerts to your phone is critical in our careers. You ideally want to know about the problem before end users start calling. That’s why SNMP is very important and being able to use it to your advantage will make your life easier.

Parsing And Visualizing Squid Proxy logs in Graylog and Grafana

Squid Proxy logs json Tutorial from this video: Parsing And Visualizing Squid Proxy logs in Graylog and Grafana : This is the json for the Grafana graph: { “annotations”: { “list”: [ { “builtIn”: 1, “datasource”: “– Grafana –“, “enable”: true, “hide”: true, “iconColor”: “rgba(0, 211, 255, 1)”, “name”: “Annotations & Alerts”, “type”: “dashboard” }
Read More »

How to Parse Snort IDS Logs in Graylog

Here is the rule that i used in the video: rule “Extract Snort alert fields” when has_field(“message”) then let m = regex(“\(\d+):(\d+):(\d+)\ \[Classification: (.+?)\] \[Priority: (\d+)]: \<(.+?)\> \{(.+?)\} (\d{1,3}\.\d{1,3}\.\d{1,3}\.\d{1,3})(:(\d{1,5}))? -> (\d{1,3}\.\d{1,3}\.\d{1,3}\.\d{1,3})(:(\d{1,5}))?\R?”, to_string($message.message)); set_field(“snort_alert”, true); set_field(“generator_id”, m[“0”]); set_field(“signature_id”, m[“1”]); set_field(“signature_revision_id”, m[“2”]); set_field(“description”, m[“3”]); set_field(“classification”, m[“4”]); set_field(“priority”, to_long(m[“5”])); set_field(“protocol”, m[“7”]); set_field(“src_addr”, m[“8”]); set_field(“src_port”, to_long(m[“10”])); set_field(“dst_addr”, m[“11”]); set_field(“dst_port”,
Read More »